
Funds
Menu
Asia Fund
Menu
Yeoman 3-Rights Value Asia Fund VCC invests in the undervalued securities of companies listed in Asia ex–Japan to achieve total investment returns.
Fund Presentation
Performance
Asia Portfolio Performance
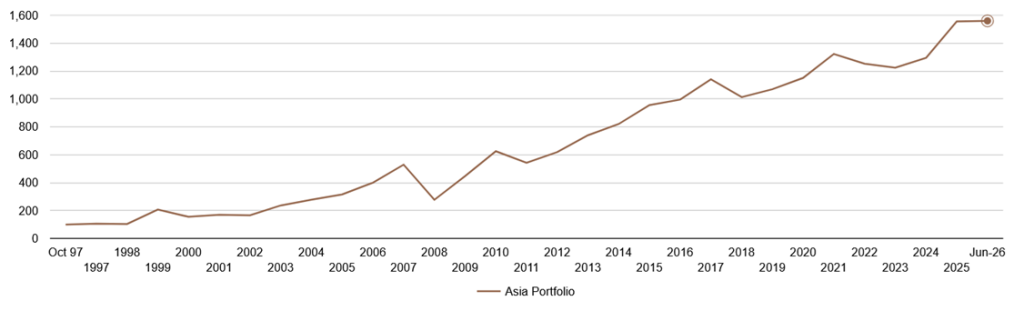
* Chart shows performance from 31 October 1997, re-based to 100. Asia Portfolio: Performance from 19 January 2005 fund inception onwards refers to Yeoman 3-Rights Value Asia Fund VCC (“Asia Fund”). Performance prior to 19 January 2005 refers to segregated accounts reported on a composite basis (comparable investment objective). Performance in SGD. Dividends re-invested. Net of fees.
Performance: 28 years 8 months ending June 2026
| Period | Asia Portfolio |
| Since Inception | |
| CAGR (per annum) | 10.30% |
| Cumulative Performance | 1,559.55% |
| Year To Date 2026 | 0.27% |
| Historical Performance | |
| 2025 | 18.78% |
| 2024 | 5.24% |
| 2023 | (2.10%) |
| 2022 | (4.88%) |
| 2021 | 23.60% |
| 2020 | 7.59% |
| 2019 | 5.59% |
| 2018 | (11.24%) |
| 2017 | 14.64% |
| 2016 | 4.10% |
| 2015 | 16.51% |
| 2014 | 10.92% |
| 2013 | 19.46% |
| 2012 | 14.19% |
| 2011 | (13.29%) |
| 2010 | 40.00% |
| 2009 | 61.31% |
| 2008 | (47.62%) |
| 2007 | 32.28% |
| 2006 | 26.59% |
| 2005 | 13.65% |
| 2004 | 17.46% |
| 2003 | 42.87% |
| 2002 | (2.57%) |
| 2001 | 9.53% |
| 2000 | (25.14%) |
| 1999 | 99.32% |
| 1998 | (2.49%) |
| 1997* | 6.60% |
Note: Performance In SGD. Dividends re-invested. Net of fees
*1997 Performance is from end October to end December